World Energy Coal -
November 1, 2012
A couple weeks ago we began this series with a
cross section of world
energy use. Our focus is generally on oil and gas, but today we
look at the number two fuel: coal. As it turns out coal is a
major factor in petroleum supply.
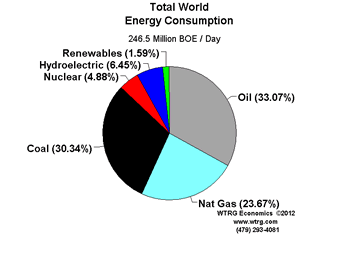
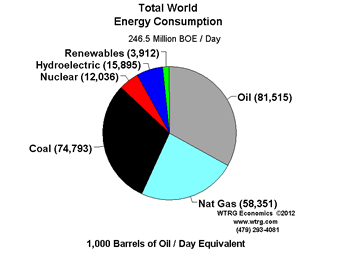
Currently coal has 30 percent of the energy market. We represent coal
in Barrels of Oil Equivalent (BOE). BOE or Quadrillion Btu are
preferable measures since the energy content of a ton of coal is
variable depending on quality.
With
all of the concern about CO2 emissions over the last decade it might be
expected that coal consumption would decline or at least show slower
growth. With the exception of the impact of the 2008 recession just the
opposite is true.
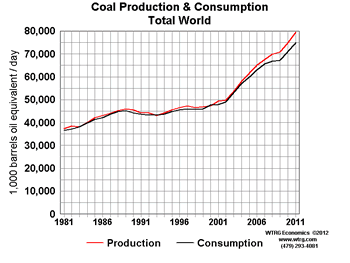
According to the estimates from BP, coal consumption is 74.8 million BOE / day
up 27.0 million BOE (56.4%) in the last ten years.
That is an annual growth rate of 4.6%. To put that 27.0 million / day BOE increase in
perspective, the gain over the last ten years is greater than the
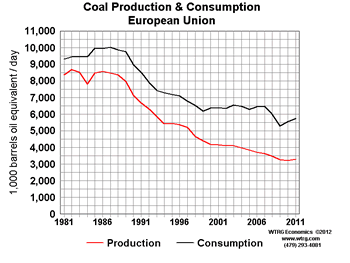
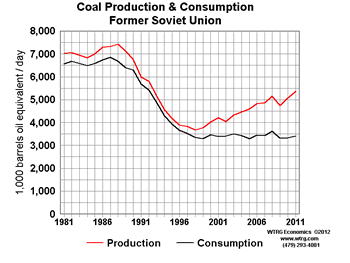
combined total consumption of North America (10.7) , the European Union
(5.7), and Former Soviet Union (3.4). It is greater than the 22.2 million BOE used in all of the
developed, OECD, countries.
Here
in the United States and in Europe CO2 emissions get a lot of press.
The idea that we could have a significant impact on global emissions
through Carbon Capture and Storage (CCS) or even the substitution of
other fuels with lower emissions borders on absurdity. The higher
associated costs would make U.S. and European manufactured goods more
expensive and shift the production to Asia. The net effect on CO2 might
even be an increase as shipping of the goods would add to emissions. It
would only shift the location of emissions.
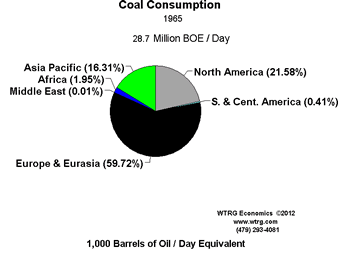
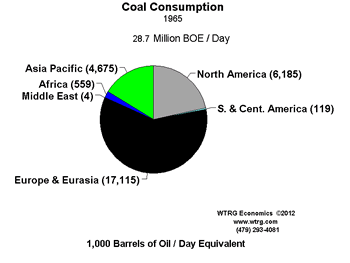
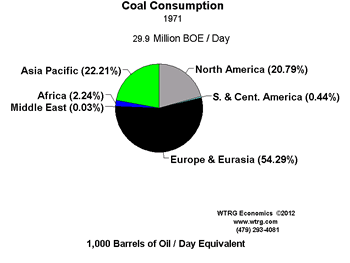
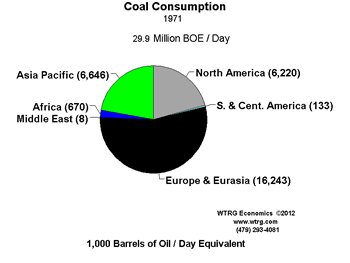
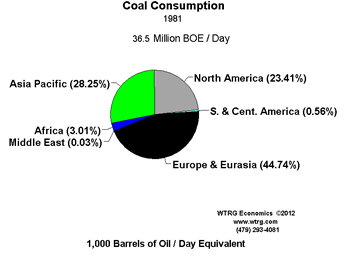
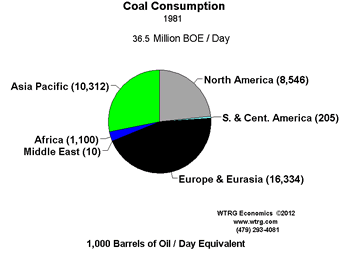
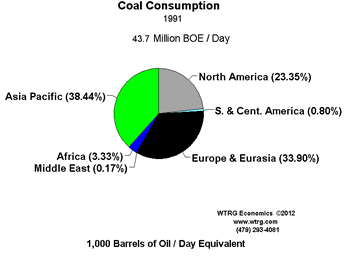
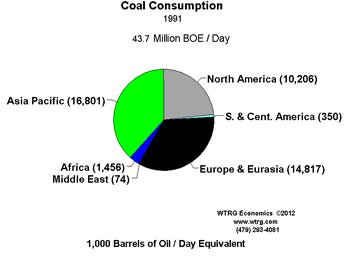
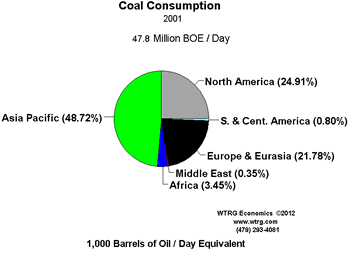
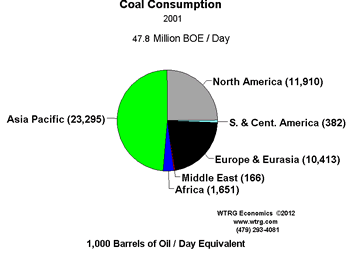
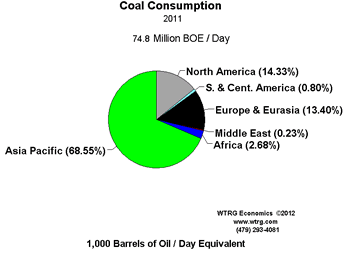
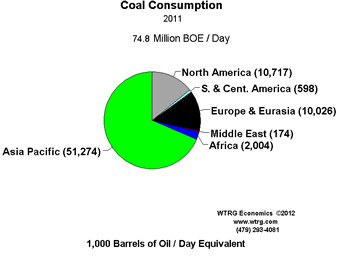
Scan trough the six rows of pie charts to see the change in the mix on
a regional basis through time as Asia replaces Europe and Eurasia as
the major
consumer of coal.
|
|
|
Important Note and
Summary for readers:
This article began as part of a series to provide an overview of world
energy consumption and production. After the first article laid out the
cross section of energy use we turned to coal. Our purpose was to put
coal in perspective as one of several energy sources.
As we analyzed the data
it became apparent that coal use in the developed countries was flat or
declining while Asian use was soaring. This led to one of those eureka
moments only tangentially related to the purpose of our study: The
adoption of CCS (Carbon Capture and
Storage) or even the total elimination of coal as a source of power
United States would have minimal lasting impact on world CO2 emissions.
We came to the same conclusion if all of the developed countries
halted the use of coal.
If Asia and China, in particular, continues to increase coal use at the
pace of the last decade the effect of the elimination of all coal use
on CO2 emissions by the developed OECD countries would be erased in
five years. You can almost do the calculations on the back of an
envelope.
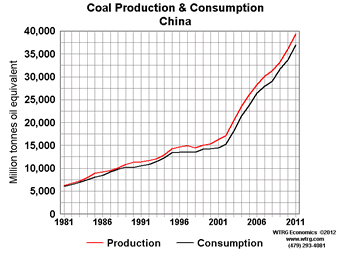
In 2011, China's coal use was the equivalent of 36.9 million barrels of
oil per day (BOE) and increased at an average annual rate of 9.8
percent. At that rate it it would take 31 months to increase 10.8 BOE.
That gain matches the total use here in the US. The European Union's
coal consumption of 5.7 million BOE / day would be replaced in 19
months. All of the OECD countries currently use 22.1 Million BOE / day
which takes 60 months (5 years) to match.
If we get out a new envelope and include all of Asia which consumes
51.3 million BOE /day and grew at an annual rate of 8.2% the results
are as follows: U.S. use is matched in 27 months, European Union in 16
months and the OECD countries in 4.5 years.
The conclusion is obvious. Halting coal use in the West will not have a
lasting impact on CO2 emissions. In five year we would be no better off
than we are today. Additionally, the loss of coal as a cheap energy
source would result reduce the ability of Western economies to compete
in the manufacture of goods and shift more production to Asia.
|
 |
|
|
 |
 |
|
 |
 |
|
 |
 |
|
 |
 |
|
 |
 |
|
 |
 |
|
North America, Europe
& Eurasia
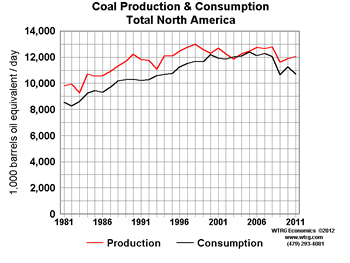
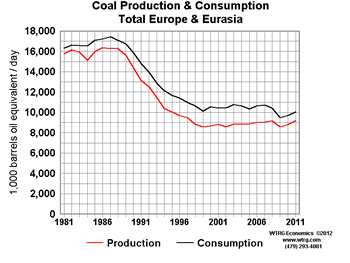
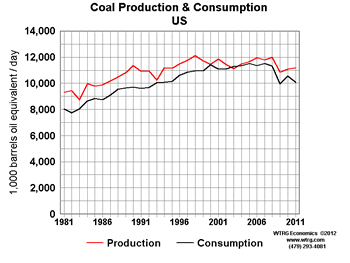
There are no surprises here. North American consumption is down 9.1% in
the last decade. Europe and Eurasia is off 3.7%. Most of the lower use
in Europe
and Eurasia occurred in the first half of our 30 horizon.
|
|
|
|
 |
 |
|
 |
 |
|
 |
|
|
Asia Pacific Region
& China
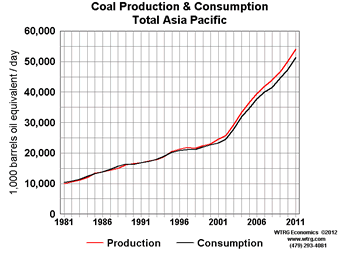
As we pointed out before the increases are all in this Asia Pacific
Region up 28.0 million BOE / day (120%) in the last decade. It now
represents 68.6% of total world consumption. China increased 22.5
(155.2%) and uses almost half (49.45) of the world's coal.
|
|
|
|
 |
 |
|
Africa & South
and Central America
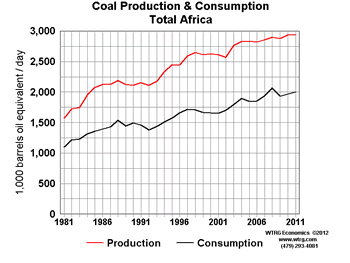
Africa's coal use has shown only modest growth. IN the last decade it
grew by 353,000 BOE / day (1.3%). all of the increase an
almost all coal used on the continent is by South Africa.
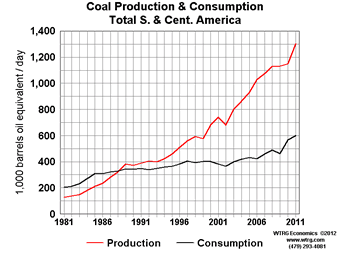
Coal consumption in South and Central America increased 216 (56.6%) but
is only responsible for less than one percent of total world
consumption.
|
|
|
|
 |
 |
|
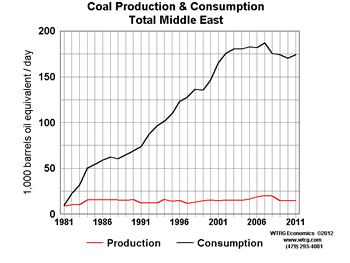
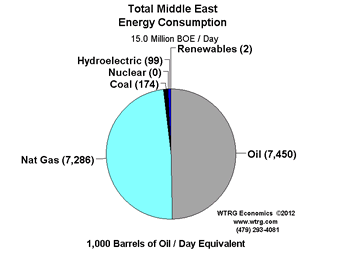
Middle East
Middle
East consumption of coal is only 174,000 BOE / day. With 0.2% of total
world consumption it is almost not worth mentioning. However, the low
level of consumption is exactly what makes it so important.
In the Middle East, virtually all electric power is generated from oil
or natural gas. Saudi Arabia alone consumes nearly a million barrels
per day of oil for power generation during the summer months. If this
generation capacity were replaced by coal which is worth less than a
fourth the price of crude, at $100 per barrel the Saudis could increase
their net revenue by at least 75 million dollars per day.
Conclusion
Despite all the concern about CO2 emissions from coal global
consumption will continue to rise at a rapid pace driven by Asian
consumption. Most of the gains will come from China and India. The rate
of increase in coal consumption which averaged 8.2% per year for the
last decade contrast sharply with petroleum gains of
1.2% annually.
|
|
 |
|
 |
|
|
|
|
|
|
|
|


